Dashboards Are Not a Competitive Advantage Anymore
Why visibility alone won't move your business forward, and what the next generation of data-driven companies actually look like.
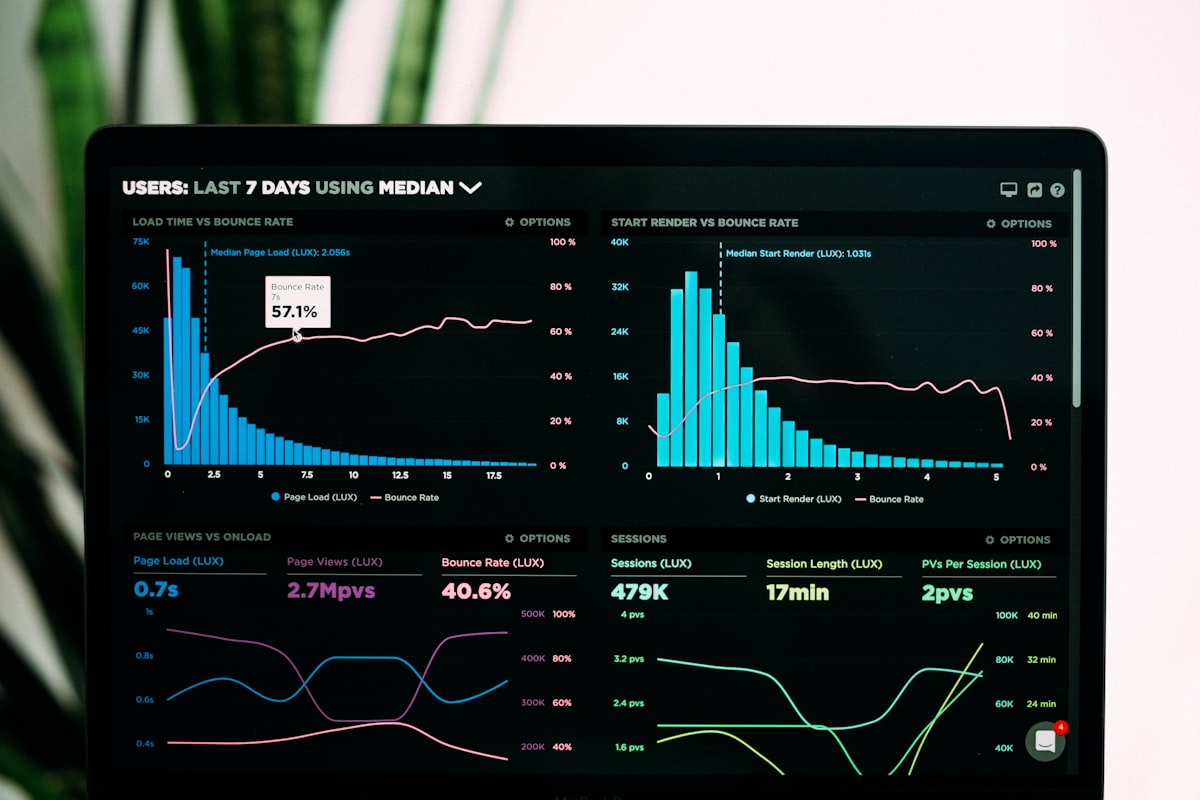
Everyone Has Dashboards Now
Let's start with an uncomfortable truth: your dashboards are not special. The same Tableau workbook, the same Power BI report, the same Looker explore that you spent six months building, your competitor likely has something functionally identical. Maybe prettier. Maybe uglier. But fundamentally the same.
In 2026, business intelligence is table stakes. Every enterprise, every mid-market company, and most startups past Series A have some form of dashboard infrastructure. The tools are mature. The talent pool is wide. Cloud data warehouses have made the underlying compute almost trivially accessible.
And yet, most organizations treat their BI layer as if it were a strategic asset. Entire teams are dedicated to maintaining dashboards that, if we're honest, nobody looks at after the first week. Reports are generated, distributed, and promptly ignored. The quarterly board deck is the only time the data warehouse truly earns its keep.
The most dangerous illusion in modern enterprise is confusing data visibility with data-driven decision-making. They are not the same thing. They never were.
Why Visibility ≠ Velocity
There's a seductive logic to dashboards: if people can see the numbers, they'll make better decisions. This is the foundational assumption of every BI initiative since the late 1990s. And it's wrong, or at least, dramatically incomplete.
Visibility gives you awareness. It tells you that revenue dipped last quarter, that customer churn is trending upward, that your supply chain lead times have increased. What it doesn't do is tell you why, what to do about it, or whether the pattern will continue. It certainly doesn't act on the insight automatically.

Consider a retail company that can see, in real time, that a particular product category is underperforming in the Midwest. That's visibility. Velocity would be a system that automatically adjusts regional pricing, reallocates marketing spend, and triggers a supply chain reconfiguration, before the quarterly review even happens.
The gap between these two states is enormous. And most companies are parked firmly on the visibility side, congratulating themselves for having dashboards while their more sophisticated competitors are building decision systems.
The Five Stages of Data Maturity
Every organization sits somewhere on a maturity curve. Understanding where you are, honestly, is the first step toward understanding what competitive advantage actually looks like in 2026.
Stage 1: Reporting, "What happened?"
This is where most companies started. Monthly reports. Excel exports. SQL queries run by an analyst who's the only person who knows where the data lives. The focus is purely retrospective: revenue last month, headcount last quarter, costs year-over-year. It's necessary, but it's archaeology, you're studying the past.
Stage 2: Monitoring, "What's happening now?"
Real-time dashboards. Alerts when KPIs breach thresholds. This is where Tableau, Power BI, and Looker live. It's a meaningful step up from reporting because you're no longer waiting for the month-end close to know something is wrong. But you're still fundamentally reactive. You see the fire after it's started.
Stage 3: Prediction, "What's likely to happen?"
Statistical models. Machine learning. Demand forecasting. Churn prediction. This is where the shift from descriptive to prescriptive begins. Fewer than 15% of enterprises operate consistently at this level, despite the fact that the tooling has been available for over a decade. The barrier isn't technology, it's organizational trust in models over intuition.
Stage 4: Automation, "Do it without asking."
This is where predictions trigger actions automatically. Dynamic pricing engines. Automated inventory replenishment. Self-adjusting ad spend allocation. The human is still in the loop for strategy and oversight, but the execution is machine-driven. This is where competitive advantage starts to compound.
Stage 5: Decision Systems, "Decide and learn."
The apex. Closed-loop systems that make decisions, measure outcomes, and refine their own logic. Reinforcement learning applied to business operations. The organization doesn't just react to data, it's governed by data. This is what Amazon, Netflix, and the most advanced fintech companies have built. It's also what's now becoming accessible to mid-market enterprises through AI-first architectures.

Where Most Companies Are Stuck
The honest answer? Somewhere between Stage 2 and Stage 3. Most organizations have invested heavily in monitoring, beautiful dashboards, well-structured data warehouses, competent BI teams, but haven't made the leap into prediction and automation.
The reasons are consistent across industries:
- ●Data quality is good enough for dashboards but not for models. Inconsistent definitions, missing fields, and undocumented transformations make ML pipelines fragile.
- ●Organizational incentives reward dashboard delivery, not decision automation. BI teams are measured by the number of reports shipped, not by business outcomes influenced.
- ●Fear of algorithmic decision-making persists in boardrooms. Executives who built their careers on intuition are reluctant to cede authority to models.
- ●Technical debt in the data stack makes iteration slow. Monolithic ETL pipelines, tightly coupled systems, and the absence of proper DataOps practices mean that even small changes take weeks.
The companies that break through this ceiling don't do it by buying better tools. They do it by fundamentally rethinking the relationship between data, decisions, and execution.
What Real Advantage Looks Like Today
Competitive advantage in 2026 isn't about having more data or better charts. It's about three things:
1. Speed of Decision Loop
How quickly can your organization go from signal to action? If a customer's behavior pattern shifts, does it take three weeks for the insight to percolate through dashboards and meetings, or does it trigger an automated response in minutes? The time between insight and action is the new competitive frontier.
2. Reliability of the Data Foundation
You cannot build prediction and automation on unreliable data. This means investing in data contracts, observability, lineage, and testing, the unglamorous infrastructure that separates production-grade data systems from science experiments.
3. Institutional Willingness to Automate
The hardest part isn't technical. It's cultural. Organizations that win are the ones where leadership actively pushes decision-making authority downstream, into systems, into algorithms, into automated workflows. Not blindly, but deliberately, with proper governance and feedback loops.
The next generation of market leaders won't be the companies with the best dashboards. They'll be the ones whose systems make better decisions, faster, than any human reviewing a report could.
The Path Forward
If your data strategy in 2026 still revolves around dashboard delivery, you're optimizing for the wrong outcome. Dashboards are infrastructure, they're necessary, but they're not differentiating. The real question isn't 'Can we see what's happening?' It's 'Can our systems act on what's happening, intelligently, reliably, and at speed?'
At InclinedPlane, we help organizations make this leap. Not by replacing dashboards, but by building the predictive, automated, and decision-ready layers on top of them. Because in an era where everyone can see the data, the advantage belongs to those who can act on it first.
Image Credits
- Luke Chesser , Data analytics dashboard on a large monitor showing colorful charts and metrics · via Unsplash
- Carlos Muza , Business analytics workspace with multiple screens showing marketing metrics and campaign performance data · via Unsplash
- Stephen Dawson , Complex data visualization showing interconnected network of glowing data points · via Unsplash